ABERCROMBIE & FITCH CO stock market tips technical viewpoint updated on 24th June 2015, Wednesday.


ABERCROMBIE & FITCH CO.


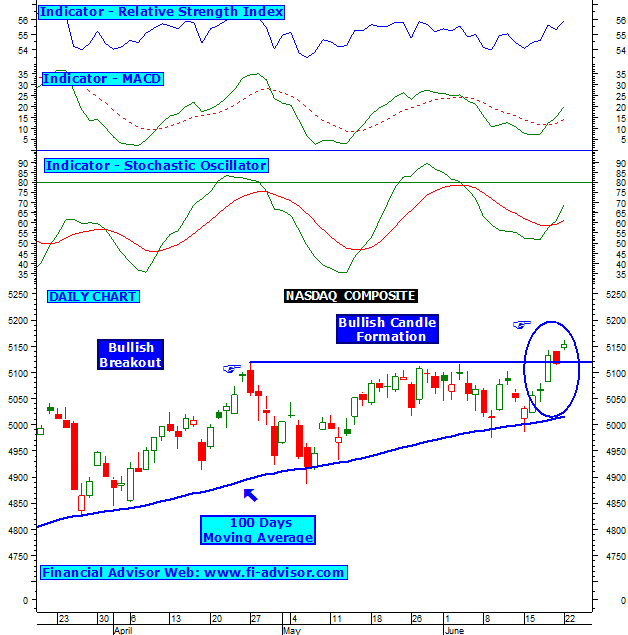
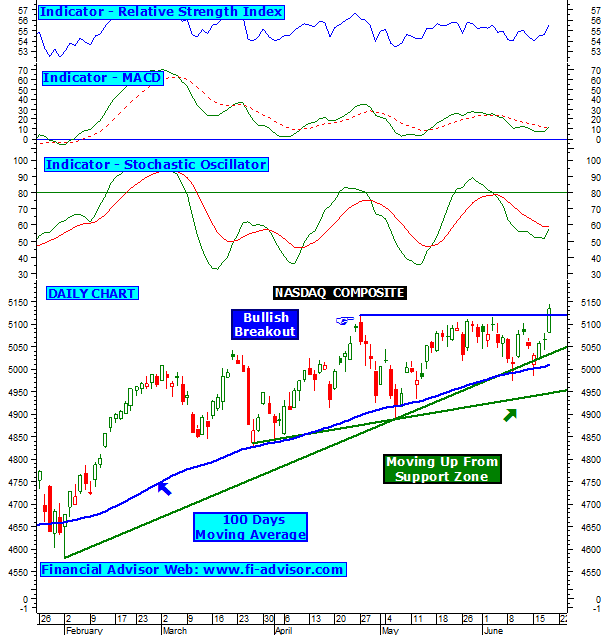
ABERCROMBIE & FITCH stock market tips technical chart indicates that stock has formed head and shoulder pattern in daily chart and it now on the verge of breakout.
Technical indicates stock can see further bulls action once it closes and holds above its trend line resistance as shown above. Till then stock can zig zag in its range.

Alexion Pharmaceuticals US stock market forecast for free chart updated on 24th June 2015, Wednesday.


ALEXION PHARMACEUTICALS


Alexion Pharmaceuticals US stock market forecast stock analysis for free technical chart indicates that stock is moving in a up channel pattern in daily chart bulls will be favored as long as it is moving in up channel. On upper side stock is heading to test its previous top resistance as shown in above image.
Once stock closes and holds above its resistance zone then further action can be seen from bulls but if it fails to hold above then correction can be seen in this stock close watch.

Nasdaq composite Japanese candlestick patterns updated on 24th June 2015, Wednesday.


Nasdaq composite daily chart indicates that index is forming bullish candlestick pattern this indicates bulls are currently active and we can see some further price rise action once it closes and holds above its yesterday`s high.
MACD and stochastic oscillator is also moving in positive zone this will favor bulls.

Adobe systems technical forecast updated on 23rd June 2015, Tuesday.


ADOBE SYSTEMS


Adobe systems US stock market forecast chart indicates that is has given a bullish breakout signals as it has closed above its major trend line resistance zone so as long as it holds above bulls will be favored and further price rise can be seen in coming days.
So far volumes are also supporting, their is a sudden increase in volumes this indicates bulls are currently active.

Visit this blog daily for more free nasdaq stocks chart.

S&P 500 Us stock market forecast graph updated on 23rd June 2015, Tuesday.


S&P 500 technical graph indicates that it is moving up from 100 DMA this indicates bulls will be favored. On upper side index will find resistance around its previous top once it closes and holds above its previous top then bulls will be favored and further bulls action can be seen in coming days.
But if it fails to hold above then correction can be seen so far its indicators are moving in +ve zone this will favor bulls.

Click now for more free stock analysis on US stock market stocks.

Nasdaq composite us stock market chart updated on 23rd June 2015, Tuesday.


Nasdaq composite US stock market technical chart indicates that it is moving up from 100 DMA and gave a bullish breakout signal as it closed above its previous top, chart indicates as long as it holds above bulls will be favored and further price rise can be seen in coming days.
Candlestick pattern also indicates that it has formed bullish pattern in daily chart this indicates bulls are currently active as long as it holds above its yesterdays high.

Ecolab incorporated US stock market stock updated on 22nd June 2015, Monday.


Ecolab share is listed on US Stock market and its technical chart indicates that it is finding strong trend line resistance at current levels so as long as it holds below its trend line bears will be favored and correction can be seen but once it closes and holds above its trend line then further price rise can be seen in coming days.
Its macd indicator is moving in positive zone and above level zero this will favor bulls if stock holds above its trend line resistance.

Carnival corporation us stock market forecast updated on 22nd June 2015, Monday.


Stock finding strong trend line resistance at current levels, technical indicates sharp rise can be seen once stock closes and holds above its trend line resistance. If fails to hold above then correction can be seen in us stock Carnival corporation.
Recent bull candle comes with an increasing volume this indicates bulls are currently active in this stock.
Visit link for more free US stock market forecast.

ABBOTT LABS stock analysis done on 22nd June 2015, Monday.


ABBOTT Labs stock indicates that it is moving up from 100 DMA this will favor bulls as long as it holds above.
But now stock is finding strong trend line resistance at higher levels once it closes and holds above then further price rise can be seen in this stock.
Even its major trend indicators are turned positive this indicates further price rise action can be seen in coming days.
Visit our site for more free stock analysis on US stock markets.

Conagra foods stock market chart updated on 20th June 2015, Saturday.


CONAGRA FOODS


Conagra food free stock market tips technical chart indicates that stock has made a bullish formation as it has opened with a huge gap up so as long as it stays above its gap up bulls will be favored and further price rise can be seen in coming days.
Technical chart also indicates that this gap up comes with a huge jump in volume as shown in above graph. This indicates bulls are currently active.
Suggested reading - Nifty chart for short term trades.

Comcast corporation US stock market forecast chart updated on 20th June 2015, Saturday.


COMCAST CORPORATION


Comcast corporation US stock market forecast 2015 indicates that it is finding strong trend line resistance at current levels as long as it holds below bears will be favored. But once it closes and holds above then bulls will be favored.
Stochastic oscillator too turned positive this will favor bulls.
Suggested reading - NSE holidays 2015 (trading).

Apache corporation best stock tips technical chart updated on 20th June 2015, Saturday.


APACHE CORPORATION


Apache corporation best stock tips for tomorrow technical graph indicates that stock has closed below its strong trend line support zone so as long as it holds below bears will be favored and further fall can be seen in coming days.
MACD indicator too turned negative this too indicate bears will be favored.

Campbell soup company stock market tips updated on 19th June 2015, Friday.


CAMPBELL SOUP COMPANY


Campbell soup company stock chart indicates that it is finding strong trend line resistance zone, we may see some bullish action by this stock once it closes and holds above its trend line resistance or its recent top.

Amazon stock chart updated on 19th June 2015, Friday.


Amazon stock chart indicates that it is moving in a range bound zone so long as it is moving in between its range trend will be mix with no clear direction.
Current chart indicates that now stock is trying to break its range on upper side, if stock closes and holds above its range then bulls will be favored and further price rise can be seen and stock will find then resistance at its previous top.

Nasdaq analysis us stock market chart updated on 19th June 2015, Friday.


Nasdaq daily chart indicates that it is moving up from strong support zone as shown above. Now nasdaq has closed above its major trend line resistance zone so as long as it holds above its trend line bulls will be favored.
So far indicators are moving in negative but as shown above they are about to turn positive if nasdaq moves up further.
Visit site for more US stock market stock analysis.

USD CZK currency tips updated on 18th June 2015, Thursday.


USD CZK currency has formed head and shoulder pattern in daily chart and technical indicate so far it is going to test its strong trend line support.
Weakness can be seen in currency once it closes and holds below its trend line support zone as shown above.
Suggested reading - Free currency trading tips.

Dentsply international us stock market forecast chart updated on 18th June 2015, Thursday.


DENTSPLY INTERNATIONAL


Dentsply internation stock indicates that it is moving in a rectangle formation from last 6 month, as long as stock moving in between its rectangle formation trend will be mix with no clear direction.
Sharp movement can be seen in Dentsplt intl once it comes out from its range bound pattern.
Visit link for more stock analysis on us stock market.

Comcast corporation technical analysis of stock updated on 18th June 2015, Thursday.


COMCAST CORPORATION


Comcast corporation free technical analysis of stocks indicates that stock has formed triangle formation in daily chart and this indicates that sharp movement can be see once stock comes out from its triangle pattern.
Trend will be mix as long as stock moves in between its pattern.
Suggested reading - NSE holidays list for 2015.

Autozone inc stock analysis updated on 18th June 2015, Thursday.


AUTOZONE INC.


Autozone inc stock indicates that it is finding strong trend line support at current levels, as long as stock holds above its trend line bulls have some hopes for bounce back.
But once stock closes and holds below its trend line support zone then further bears action can be seen. Close watch.

Nasdaq Japanese candlestick outlook updated on 18th June 2015, Thursday.


Candlestick pattern of nasdaq indicates that it has formed doji, this usually indicates change of trend or sharp movement in next couple of days.
Suggested article - Guide to candlestick patterns.

Adobe systems free stock market tips updated on 17th June 2015, Wednesday.


ADOBE SYSTEMS


Adobe systems free stock market tips chart indicates that it is moving up from 50% fibonacci retracement support zone, as long as it holds above bulls will be favored.
On upper side stock will find strong resistance at its previous top. Once it closes and holds above its previous top then further price rise action can be seen. Close watch.

S&P 500 index looking good with a stop loss chart updated on 17th June 2015, Wednesday.


S&P 500 index moving up from 100 DMA and strong trend line support zone as shown in above technical analysis chart. Chart indicates index looking good with a stop loss of recent low.
As long as it holds above bulls will be favored and further price rise action can be seen in S&P 500 index.

Dow Jones candlestick chart pattern updated on 17th June 2015, Wednesday.


DOW JONES 
INDUSTRIAL AVERAGE (DJIA)


Dow jones Japanese candlestick pattern indicates that it has formed bullish formation in daily chart this indicates we can see some bullish action if index holds above its yesterdays high.
More over overall trend on dow index is moving in a range bond zone, sharp movement can be seen in dow index once index comes out from its range zone.

Nasdaq composite us stock market forecast chart updated on 17th June 2015, Wednesday.


US stock market index nasdaq composite chart indicates that it is moving up from strong support zone i.e trend line and 100 DMA, this indicates bulls will be favored as long as it holds above.
Weakness can be seen in US Index (nasdaq) once it closes and holds below its support zone.

COCA COLA stock chart technical analysis chart updated on 16th June 2015, Tuesday.


Coca cola stock chart indicates that it is finding strong trend line support at current levels weakness expecting once stock closes and holds below its trend line.
Suggested reading - trend trading methods in stock market.

CBS corporation stock chart updated on 16th June 2015, Tuesday.


CBS corporation stock chart indicates that its was moving in a range bound zone but stock has now closed below its downside this indicates bearish breakout.
So as long as stock holds below its rectangle formation bears will be favored and further price fall can be seen in coming days.
Suggested reading term what is financial markets.

Nasdaq Stocks Chart

Visit this blog daily for free nasdaq stocks chart and technical analysis on stock listed on Us Stock Market.

Nasdaq Composite Update - 17- 03 -16

Market Close Report: NASDAQ Composite index closes at 4,774.99 up 11.02 points.

Thursday's session closes with the NASDAQ Composite Index at 4,774.99. The total shares traded for the NASDAQ was over 1.85 billion.

Advancers stocks led declining by 2.17 to 1 ratio. There were 1954 advancers and 901 decliners for the day. On the NASDAQ Stock Exchange 42 stocks reached a 52 week high and 30 reaching lows.

The NASDAQ 100 index closed down -.09% for the day; a total of -3.94 points. The current value is 4,400.26.

DISCLAIMER

All the contents of http://nasdaqstockschart.blogspot.com are for educational purposes only and are not Investment Advice or recommendations offered to any person(s) with respect to the purchase or sale of the stocks / futures. http://nasdaqstockschart.blogspot.com shall not be held responsible for the actions of individuals, parties, or corporations taken in response to the ideas, thoughts, concepts or information presented in this blog. Hence all the visitors are requested to apply their prudence and consult their financial or investment adviser before acting on any of the Ideas in this blog.