Adobe systems technical forecast updated on 23rd June 2015, Tuesday.


ADOBE SYSTEMS


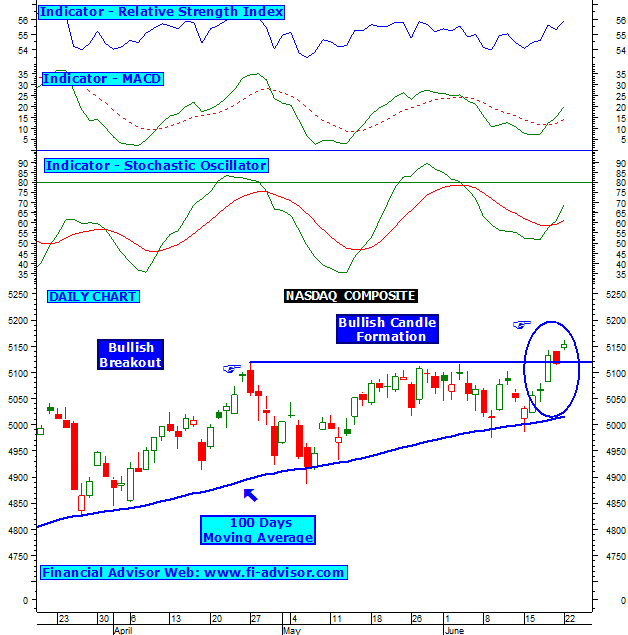
Adobe systems US stock market forecast chart indicates that is has given a bullish breakout signals as it has closed above its major trend line resistance zone so as long as it holds above bulls will be favored and further price rise can be seen in coming days.
So far volumes are also supporting, their is a sudden increase in volumes this indicates bulls are currently active.

Visit this blog daily for more free nasdaq stocks chart.

S&P 500 Us stock market forecast graph updated on 23rd June 2015, Tuesday.


S&P 500 technical graph indicates that it is moving up from 100 DMA this indicates bulls will be favored. On upper side index will find resistance around its previous top once it closes and holds above its previous top then bulls will be favored and further bulls action can be seen in coming days.
But if it fails to hold above then correction can be seen so far its indicators are moving in +ve zone this will favor bulls.

Click now for more free stock analysis on US stock market stocks.

Nasdaq composite us stock market chart updated on 23rd June 2015, Tuesday.


Nasdaq composite US stock market technical chart indicates that it is moving up from 100 DMA and gave a bullish breakout signal as it closed above its previous top, chart indicates as long as it holds above bulls will be favored and further price rise can be seen in coming days.
Candlestick pattern also indicates that it has formed bullish pattern in daily chart this indicates bulls are currently active as long as it holds above its yesterdays high.

Nasdaq Stocks Chart

Visit this blog daily for free nasdaq stocks chart and technical analysis on stock listed on Us Stock Market.

Nasdaq Composite Update - 17- 03 -16

Market Close Report: NASDAQ Composite index closes at 4,774.99 up 11.02 points.

Thursday's session closes with the NASDAQ Composite Index at 4,774.99. The total shares traded for the NASDAQ was over 1.85 billion.

Advancers stocks led declining by 2.17 to 1 ratio. There were 1954 advancers and 901 decliners for the day. On the NASDAQ Stock Exchange 42 stocks reached a 52 week high and 30 reaching lows.

The NASDAQ 100 index closed down -.09% for the day; a total of -3.94 points. The current value is 4,400.26.

DISCLAIMER

All the contents of http://nasdaqstockschart.blogspot.com are for educational purposes only and are not Investment Advice or recommendations offered to any person(s) with respect to the purchase or sale of the stocks / futures. http://nasdaqstockschart.blogspot.com shall not be held responsible for the actions of individuals, parties, or corporations taken in response to the ideas, thoughts, concepts or information presented in this blog. Hence all the visitors are requested to apply their prudence and consult their financial or investment adviser before acting on any of the Ideas in this blog.