AMAZON
- Stock moved up after giving strong bullish candle formation in daily charts.
- Close Watch Amazon currently finding strong 161.8% fibonacci retracement resistance around 376, this indicates a caution sign for bulls at current levels. If stock fails to closes and holds above 376 then we can see some correction from current levels.
- But once stock closes and holds above 376 then further price rise can be seen in coming days. Close Watch.
- Click here to know to read article on how to read candle patterns published by http://fi-advisor.com.
PFIZER
- Stock moving up from 100 DMA, chart indicates bulls will be favored.
- On down side Pfizer will find support around 30.58 as per line analysis.
- On upper side stock is on the verge of bullish breakout once it closes and holds above 33.50 (its previous top) then further price rise can be seen in coming days. Close Watch.
- Visit link http://fi-advisor.com/us-stock-market.html for more free stock market tips.
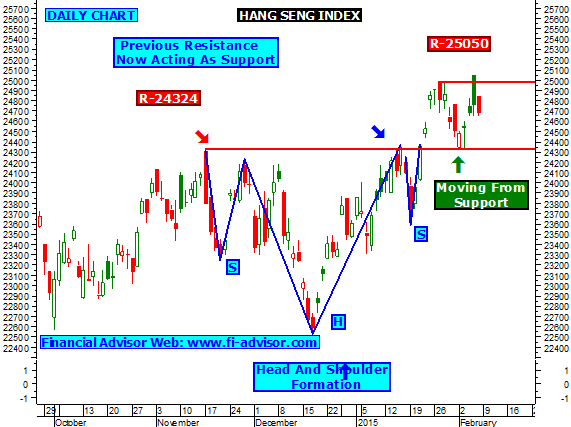
HANG SENG INDEX
Charts updated for - 11th February 2015.
- Index moved up from strong trend line support zone @ 24324.
- As per current charts Hang Seng Index is coming down from trend line resistance @ 25050 as shown above.
- This indicates as long as Index is moving in between 24324 and 25050 trend will remain mix with no clear direction.
- Sharp movement expecting once it comes out from its range zone. Close Watch.
- Check out some of the commodity trading tips visit link below.
- http://fi-advisor.com/commodity-trading.asp.
AUSTRALIA ALL ORDINARIES INDEX
- Index currently finding strong fibonacci retracement at current levels, technical indicates further strength expecting once ALL ORDINARIES closes and holds above 5800 till then bulls need to be careful at current levels index can see some correction.
- If Index falls from current levels then it will find strong support around 5672, its previous resistance will now be acting as a major support. Close Watch.
- Click here to read article on Stock Market Myths.
Nasdaq Composite Update - 17- 03 -16
Market Close Report: NASDAQ Composite index closes at 4,774.99 up 11.02 points.
Thursday's session closes with the NASDAQ Composite Index at 4,774.99. The total shares traded for the NASDAQ was over 1.85 billion.
Advancers stocks led declining by 2.17 to 1 ratio. There were 1954 advancers and 901 decliners for the day. On the NASDAQ Stock Exchange 42 stocks reached a 52 week high and 30 reaching lows.
The NASDAQ 100 index closed down -.09% for the day; a total of -3.94 points. The current value is 4,400.26.
DISCLAIMER
All the contents of http://nasdaqstockschart.blogspot.com are for educational purposes only and are not Investment Advice or recommendations offered to any person(s) with respect to the purchase or sale of the stocks / futures. http://nasdaqstockschart.blogspot.com shall not be held responsible for the actions of individuals, parties, or corporations taken in response to the ideas, thoughts, concepts or information presented in this blog. Hence all the visitors are requested to apply their prudence and consult their financial or investment adviser before acting on any of the Ideas in this blog.